Charts turn complex business numbers into clear pictures so people can understand data fast. At a glance, you save time and quickly understand scale. Looking more closely it simplifies tracking changes and spotting trends. You make better decisions by removing confusion and provide guides for action. A good chart keeps everyone focused on the most important target.
Charts for Reports with Chart.js
The Valentina Studio Reports Designer features a Chart.js Control. Drag the Chart.js object into a report region and it is immediately visible and displays basic sample data. You can set or add:
- Source Data. Use fixed JSON data, SQL query results, or values generated by JavaScript or Python
- Visual Properties. Set border and transparency properties, how it visually interacts with the rest of the report
- Print Properties. Customize appearance specifically for how the chart prints
- Chart Type. Select one of the 13 built in Chart types with options
- Chart Style. Select one of 17 visual Chart styles with options
- Scripts. Add, modify and test scripts related to the chart that run before or after the chart loads into the report.
The Chart.js Control for Reports is based on the popular, widely used and well maintained Chart.js engine.
Build Source Queries
The Charts Control works with many data sources. Use JSON for small fixed datasets or to preview a chart without a database query. Run SQL queries against a report's data source, using one query for labels and another query for series. Use JavaScript or Python when chart data must be calculated, assembled from several values, or generated without SQL.
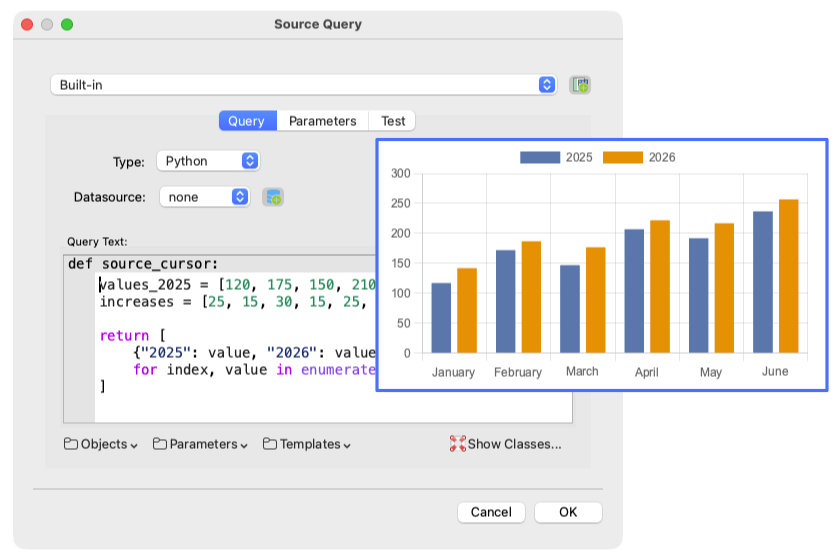
Supports Multiple Chart Types & Styles
Select one of the built in Chart Types. Charts also support visual chart styles. You can also set options for labels.
While the Report Designer Property Inspector handles standard tweaks, you can supply advanced Chart.js configuration options in raw JSON format directly inside your template. This allows developers utilizing Valentina Reports ADK to dynamically construct complex dataset arrays before passing them to the rendering engine.
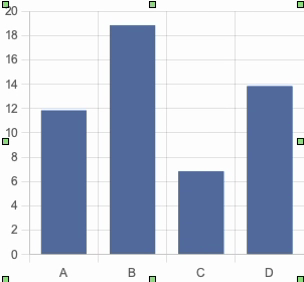 Bar Chart
 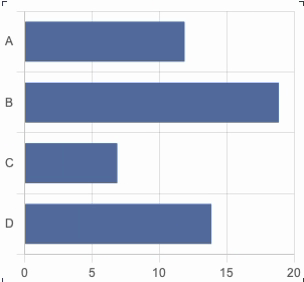 Horizontal Bar Chart Line Chart
 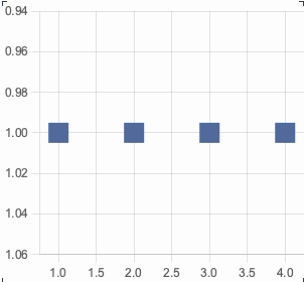 Matrix Chart
 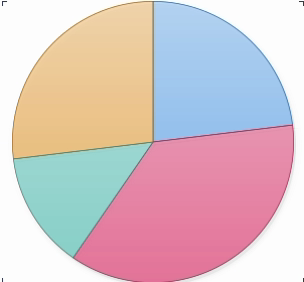 Pie Chart
 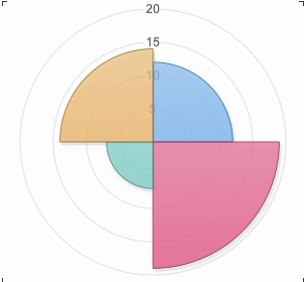 Polar Area Chart
 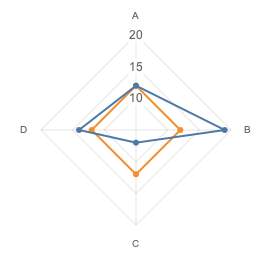 Radar Chart
 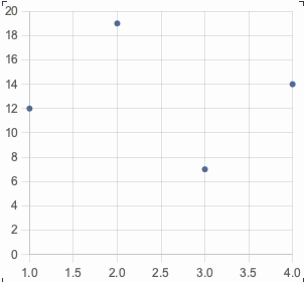 Scatter Chart
 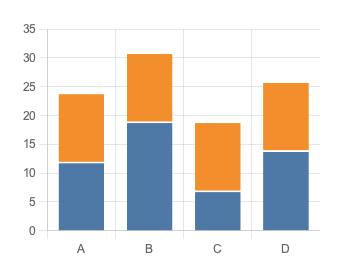 Stacked Bar Chart
 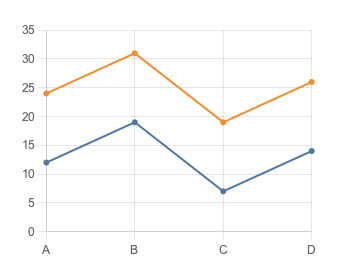 Stacked Line Chart
 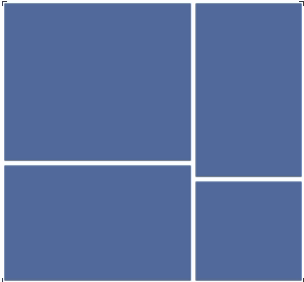 Tree Map Chart
 Ω
Ω